DevOps Dashboard
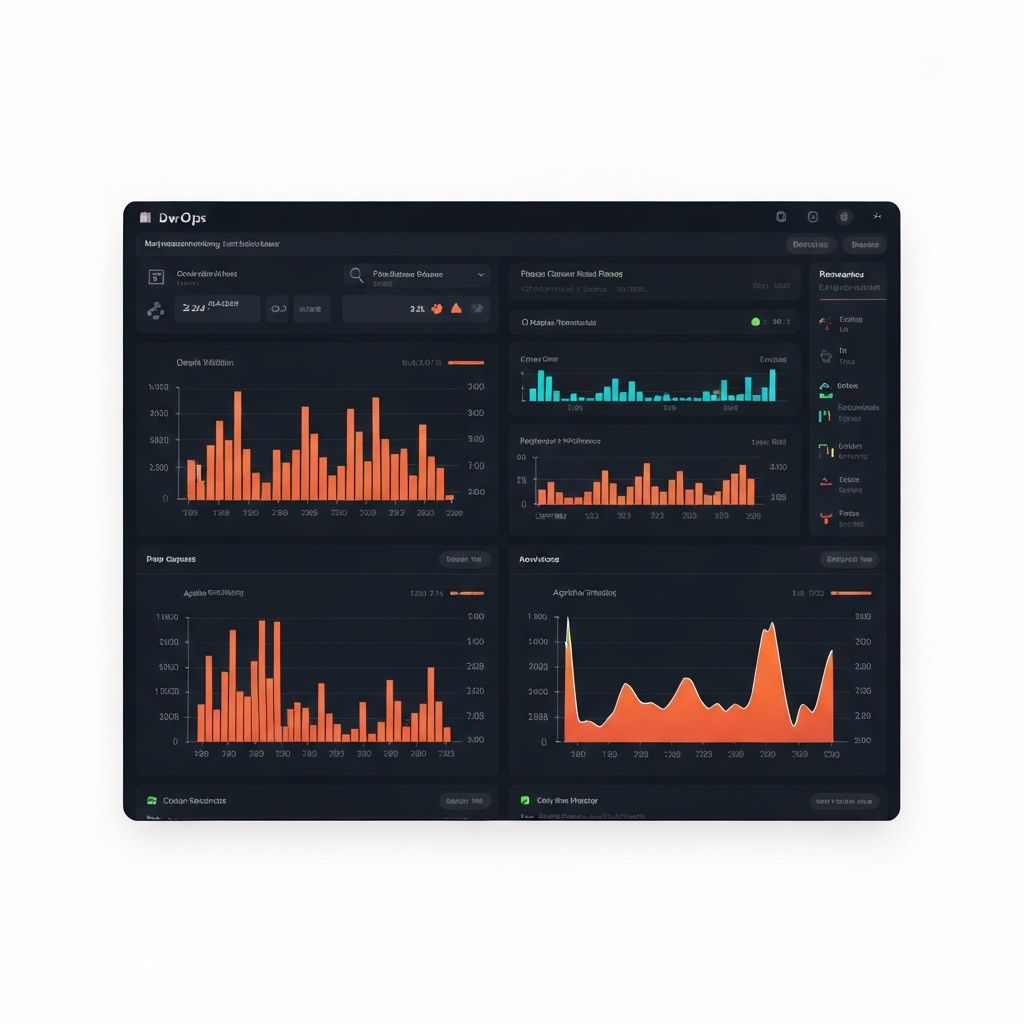
Real-time monitoring dashboard for microservices architecture. Integrated with Kubernetes and various cloud providers.
100K+
Data Points/sec
50+
Clusters Monitored
99.9%
Uptime
<30s
Alert Response Time
# Overview
DevOps Dashboard is a comprehensive monitoring and observability platform designed for teams running microservices in Kubernetes environments.
It provides real-time insights into service health, performance metrics, and resource utilization across multiple clusters and cloud providers.
The dashboard was born from the frustration of switching between multiple tools to get a complete picture of our infrastructure's health.
Problem
Modern microservices architectures generate massive amounts of data spread across multiple tools and platforms. Teams spend too much time context-switching between dashboards and correlating information from different sources.
Solution
A unified dashboard that aggregates data from Kubernetes, Prometheus, cloud providers, and custom metrics into a single, intuitive interface with powerful filtering and alerting capabilities.
# Features
- Real-time Kubernetes cluster monitoring
- Multi-cloud support (AWS, GCP, Azure)
- Custom metric dashboards with drag-and-drop builder
- Intelligent alerting with ML-based anomaly detection
- Incident management and on-call scheduling
- Cost optimization recommendations
# Screenshots
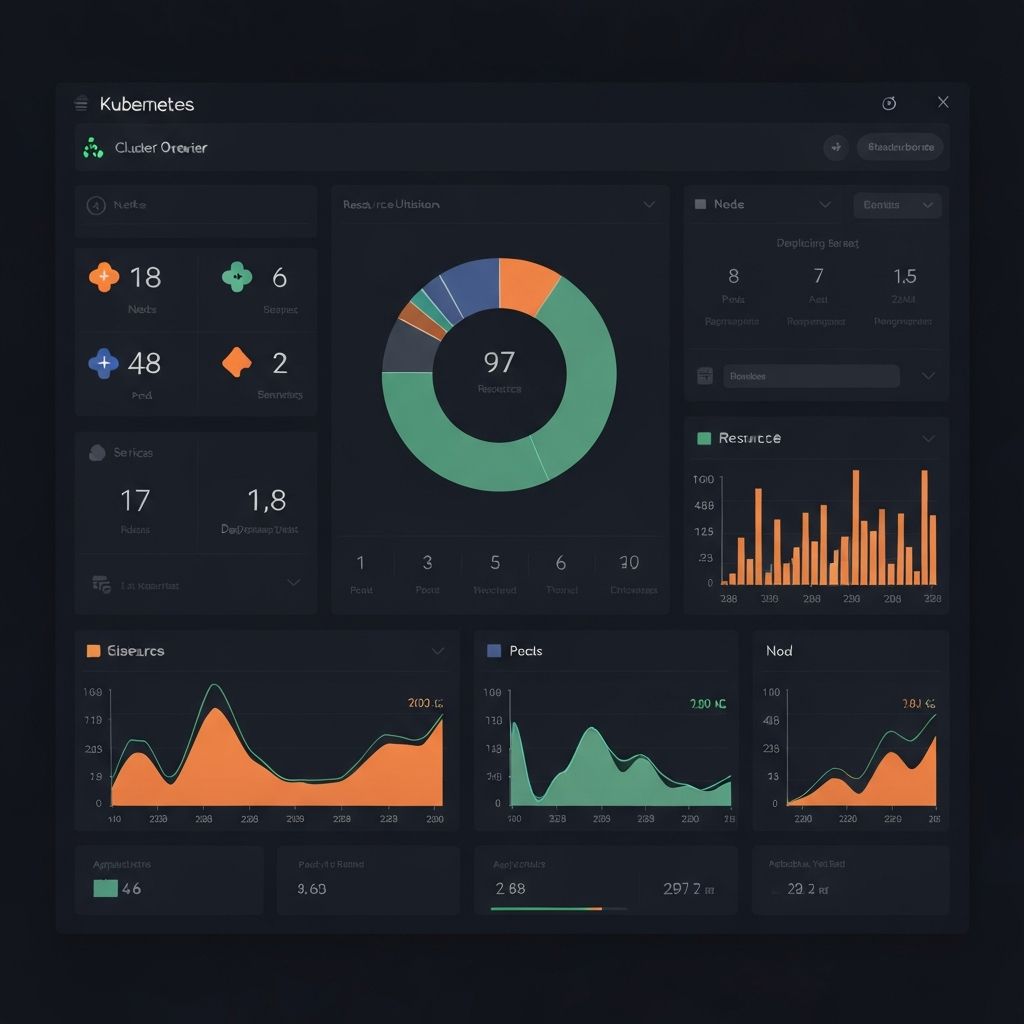
Multi-cluster Kubernetes overview
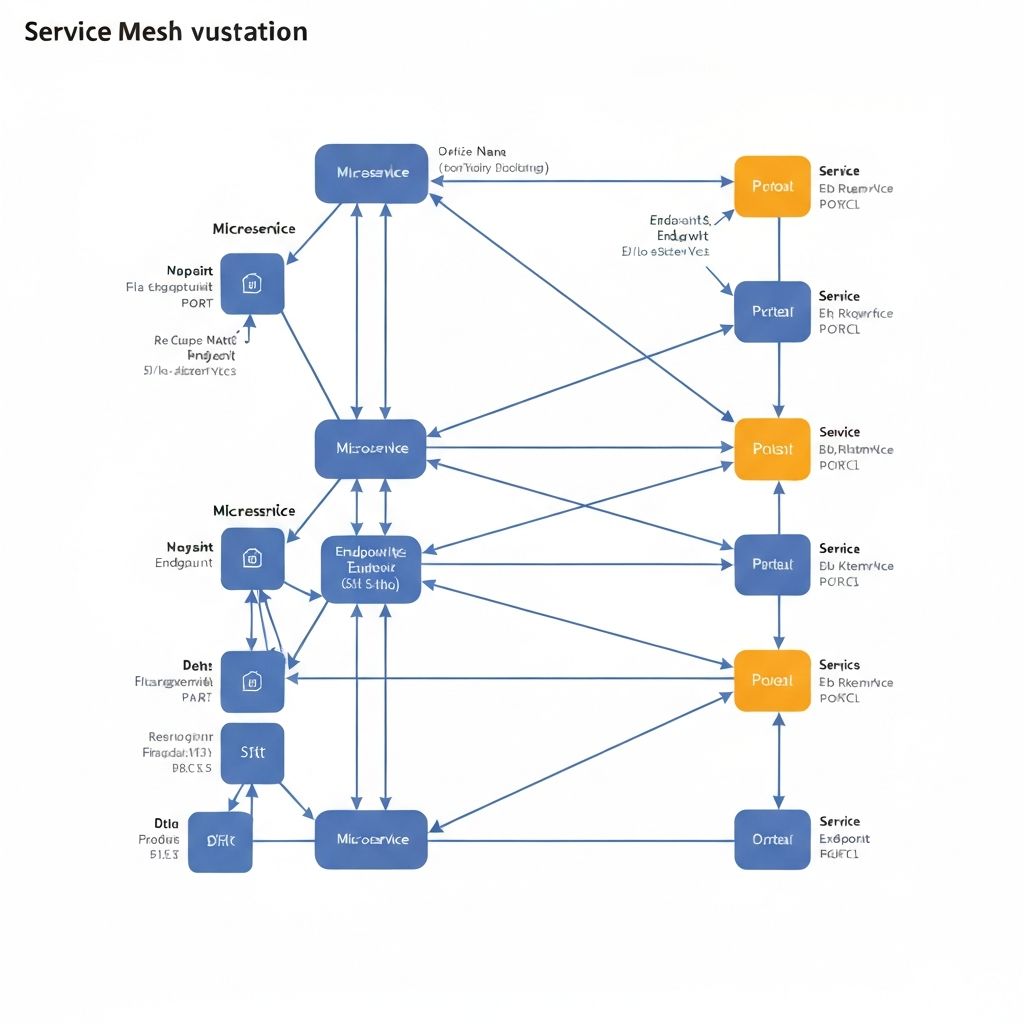
Service mesh visualization

Smart alerting configuration
Challenges
- >Handling high-cardinality metrics at scale
- >Building real-time WebSocket connections for live updates
- >Designing an intuitive UI for complex infrastructure data
- >Implementing efficient data retention and aggregation
Learnings
- >Advanced Kubernetes operator patterns
- >Time-series database optimization techniques
- >Building scalable real-time applications
- >UX design for complex technical products
Tech Stack
Frontend
Backend
Infrastructure
Monitoring
Quick Info
Status
live
Started
January 2022
Completed
June 2023